Isaac Schmidt
Full Reports
This page contains projects I have worked on that resulted in a full-length writeup, and that writeup is available. Mostly class projects and research, but some personal stuff as well.
Capstone Project: Catch Me… If You Can
- Co-Contributors: Atharv Pathak, Jeremy Sanchez, Ishaan Srivastava
As part of the Master’s program, we completed a group capstone data science project. Our original dataset of interest was one of taxi rides in New York, and we first created a kernel estimate of the spatiotemporal distribution of taxi pickups. We then incorporated a dataset of trips from the CitiBike bike sharing system, which we used to make recommendations on which bike stations to keep open and which to close. I wasn’t too happy with the project, but it turned out alright. You can read my final writeup here.
The Origins of Ethnolinguistic Diversity
- Co-Author: Andrej Leban
In the Linear Models course as part of my Master’s program, our final project was to replicate a published paper. We chose this paper by Stelios Michalopoulos, that modeled that number of languages in different geographical areas as functions of different geographic and political variables. The project involved translating the author’s Stata code into R, critiquing the original modeling choices, and extending the author’s analysis to a related dataset to check the robustness of the results. It was also an exercise in generating nice \(\LaTeX\) tables directly from R data frames. Check out our paper here, and the corresponding GitHub repository here.
Soccer Win Probabilities
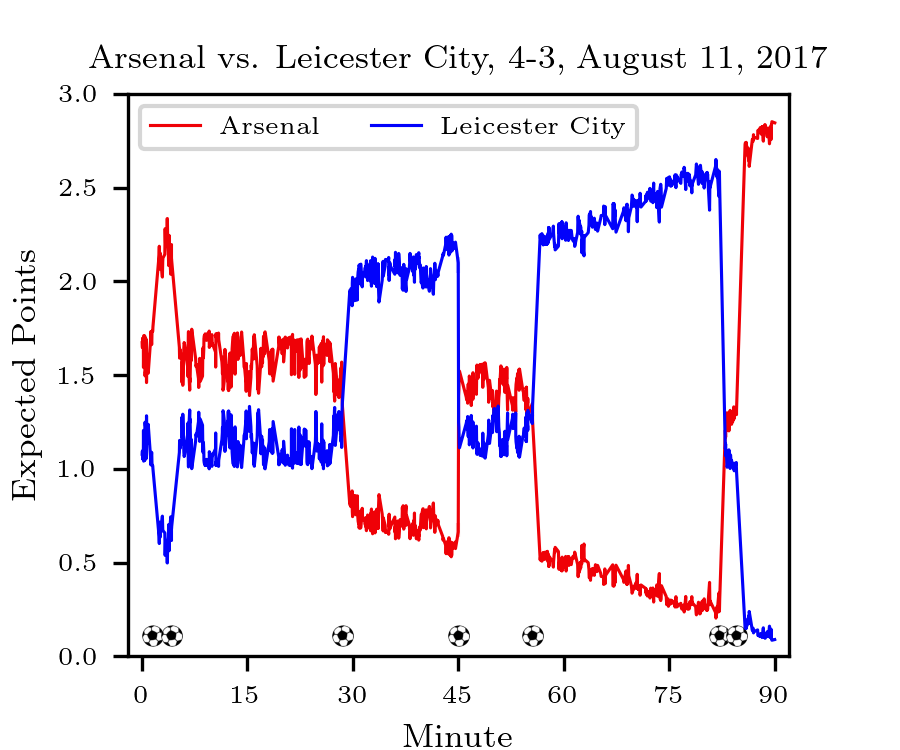
Since first being introduced to data science, I had wanted to create a soccer within-match win probability metric, similar to what has existed for a while in baseball. Given the score, the minute, and where the ball is on the field, what is the probability that either team wins, or that it ends in a draw? I was finally able to get my hands on sufficient data, and I created such a model for my final project of a graduate-level machine learning course I took in Fall 2021. I used random forests trained on one season’s worth of matches from across Europe’s top five leagues to estimate win/draw probabilities based on a few features tracked throughout the match. Read my paper here!
Clustering Colors
One question I have always been interested in is how society labels different colors. What is the dividing line between red and orange, or blue and purple? After learning about k-medoids clustering in the Algorithms for Data Science course I took in Fall 2020, I was inspired to apply this method to the colors of college basketball teams. In the process, I learned a lot about different color spaces and how to adequately measure the “distance” between different colors. It was also a fun exercise in \(\LaTeX\) and machine learning software packages. Turns out a lot of teams wear blue. Check it out here! You can also read the presentation I gave for an interview here.
SB-1120 Policy Brief
- Co-Authors: David Garcia, Julian Tucker
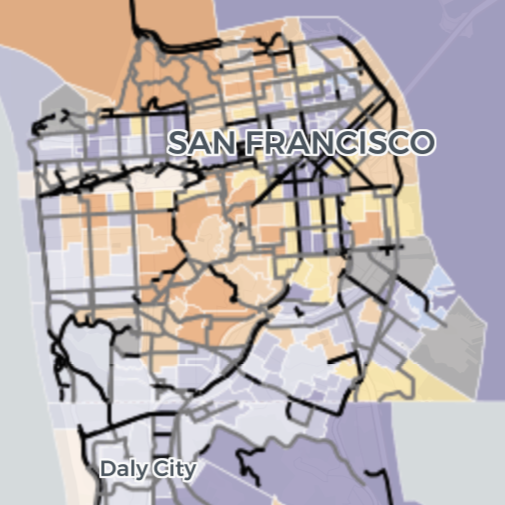
Senate Bill 1120 was proposed legislation in California that would allow for single-family residential lots to be split into two equally-sized lots. New construction could be built on the split lot, thus increasing density in residential neighborhoods. The Terner Center for Housing Innovation at Berkeley was working on a policy brief in support of SB-1120, and they called on me to run the numbers. Specifically, I determined the total counts and percentages of parcels throughout the state to which this new law would apply, which are referenced throughout the report. I’m definitely proud to have published my first “formal” work! Read the blog post and check out the full brief (PDF). Unfortunately, the bill died during the final hours of the legislative session.
Stock Price Analysis
- Co-Authors: Holly Cheek, Justin Han, Leonard Yang
For the Time Series class I took in Spring 2020, our final project was to analyze an anonymized stock price, and predict its future performance. We explored a bunch of different models, ranging from parametric models to SARIMA to basic differencing. We combined all of our findings into a professional-style report, and summarized our findings in a silly blog post. Our model predicted future prices better than at least two-thirds of the class! Not only was this an exercise in different modeling techniques, but in Markdown and \(\LaTeX\) syntax as well. Read our “blog” here, or our more detailed final report here, which also includes all of our R code.
Bike Lanes and Displacement
- Co-Authors: Khoa Đỗ, Rowan Pan
For a class assignment, my group and I looked at the relationship between the existence of bike lanes and urban displacement, as measured by the Urban Displacement Project. I collected bike lane shapefiles from various city open data portals, which I then used to calculate the total length of bike lanes per census tract. My groupmates then used that information to look at potential associations with the typologies created by UDP. We then structured our results as a blog post, which you can read here.
BART and Accessibility
- Co-Author: Rowan Pan
For another assignment, my partner and I investigated factors affecting accessibility to BART, particularly looking at the location of the Warm Springs and Fremont stations. I built my own ArcGIS road network based on a county street centerlines shapefile, which I used to calculate distance and walking times to BART for various locations. We also used data from the American Community Survey to try to determine the makeup of the neighborhoods these stations serve. Read our post here.
Monaco 2070
 For my first city planning course, our term paper assignment was to pick a city and outlay a “vision” for how that city might look in 50 years. During one of our class discussions, a student mentioned they were considering Malta, and I decided to follow the microstate idea and picked Monaco. Monaco is unique in that it is very small, very rich, and its own country. Recently it has suffered from a severe lack of housing—even in the most expensive city in the world, demand is far exceeding supply. The city can’t grow outwards (it either hits water or an international border), and growing upwards would mean losing its charm, so I decided to base my vision around a radical underground housing plan. I reference other human underground spaces, such as in Montreal, and the informal underground housing market in China. While my plan is certainly quite unrealistic, this was quite a fun research exercise. I also got to improve my non-existent graphic design skills. No data science here, but still please read!