Isaac Schmidt
School Projects
This page contains descriptions of some additional school and extracurricular research projects I have worked on.
Graph Distances in the Data-Stream Model
In Fall 2020, I took a graduate-level class titled “Algorithms for Data Science.” Our big project was to present on a published paper in the field. Check it out below:
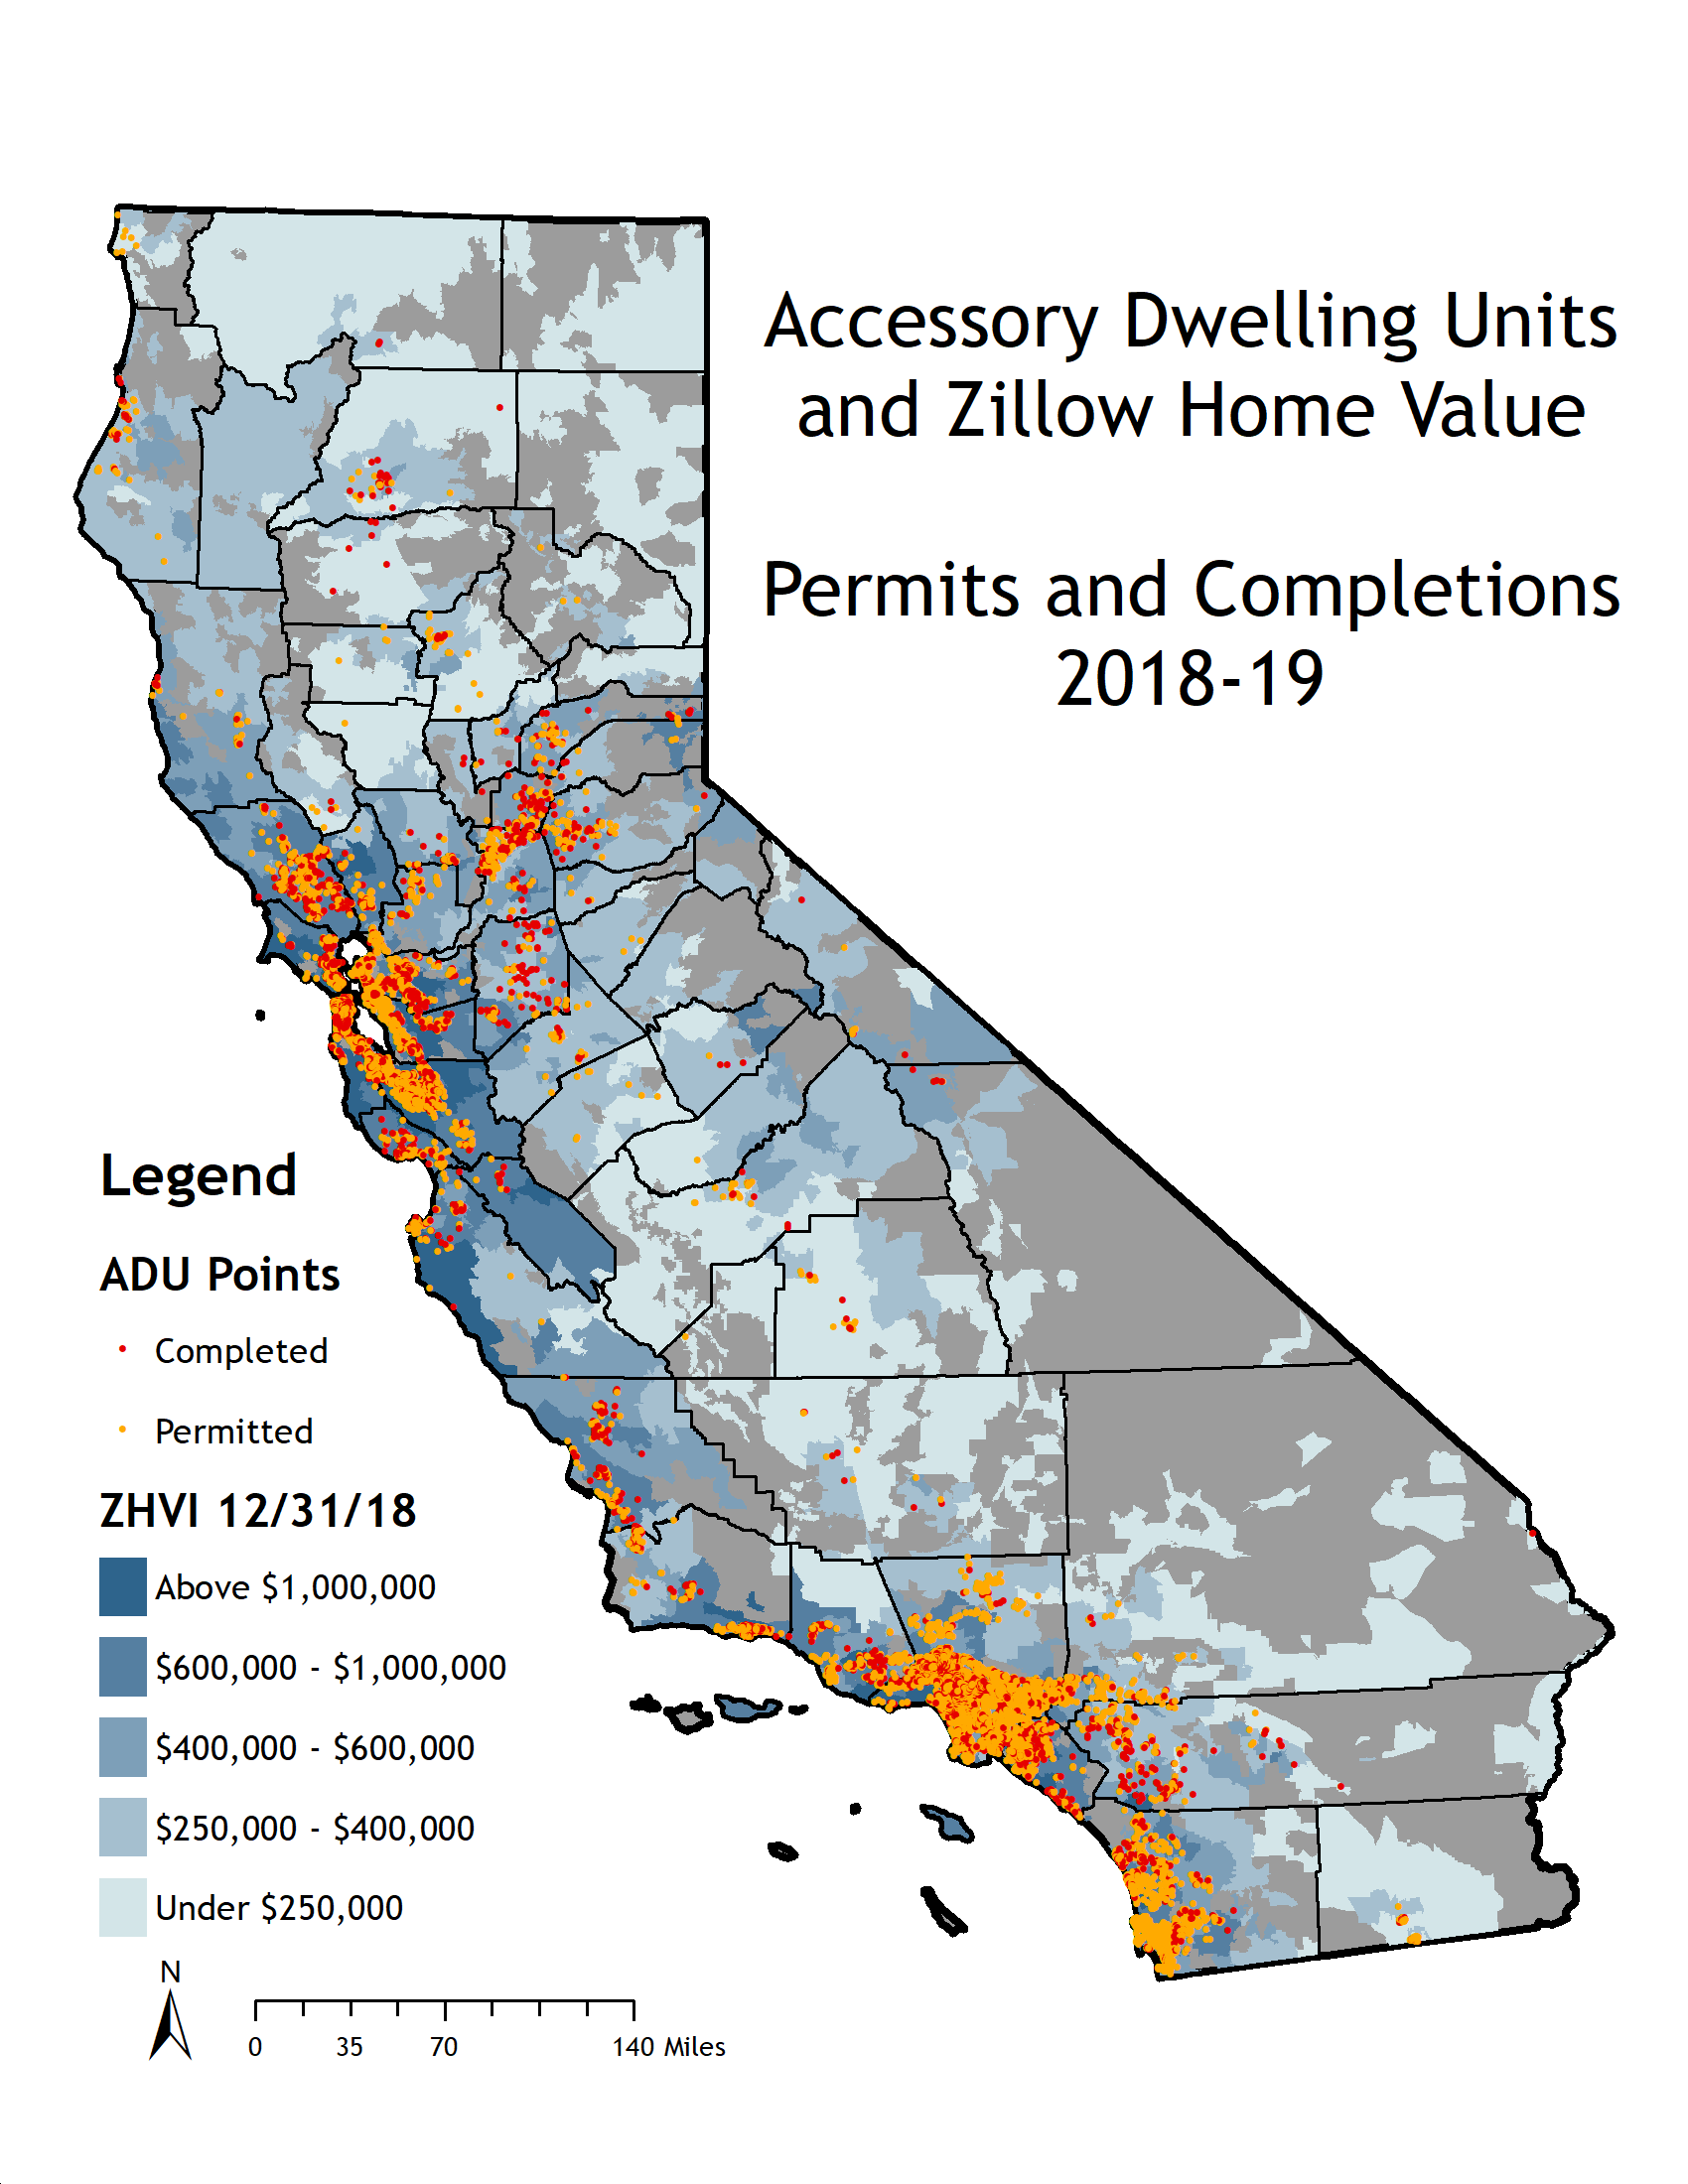
Housing Research
Most of my research with Prof. Chapple has involved working on projects related to housing reform. In addition to the SB-1120 brief, I also worked on collecting and joining datasets for a model that determined the factors driving the construction of accessory dwelling units (ADUs), which helped the publication of our report. This involved working with large parcel-level datasets for the state of California, as well as other data sources like the ACS and LEHD survey. I also worked on this map displaying where in the state ADUs are built. Another project that I worked on was trying to determine the number of new units built in the state at the block level, again using parcel data.
Supply Chain Management
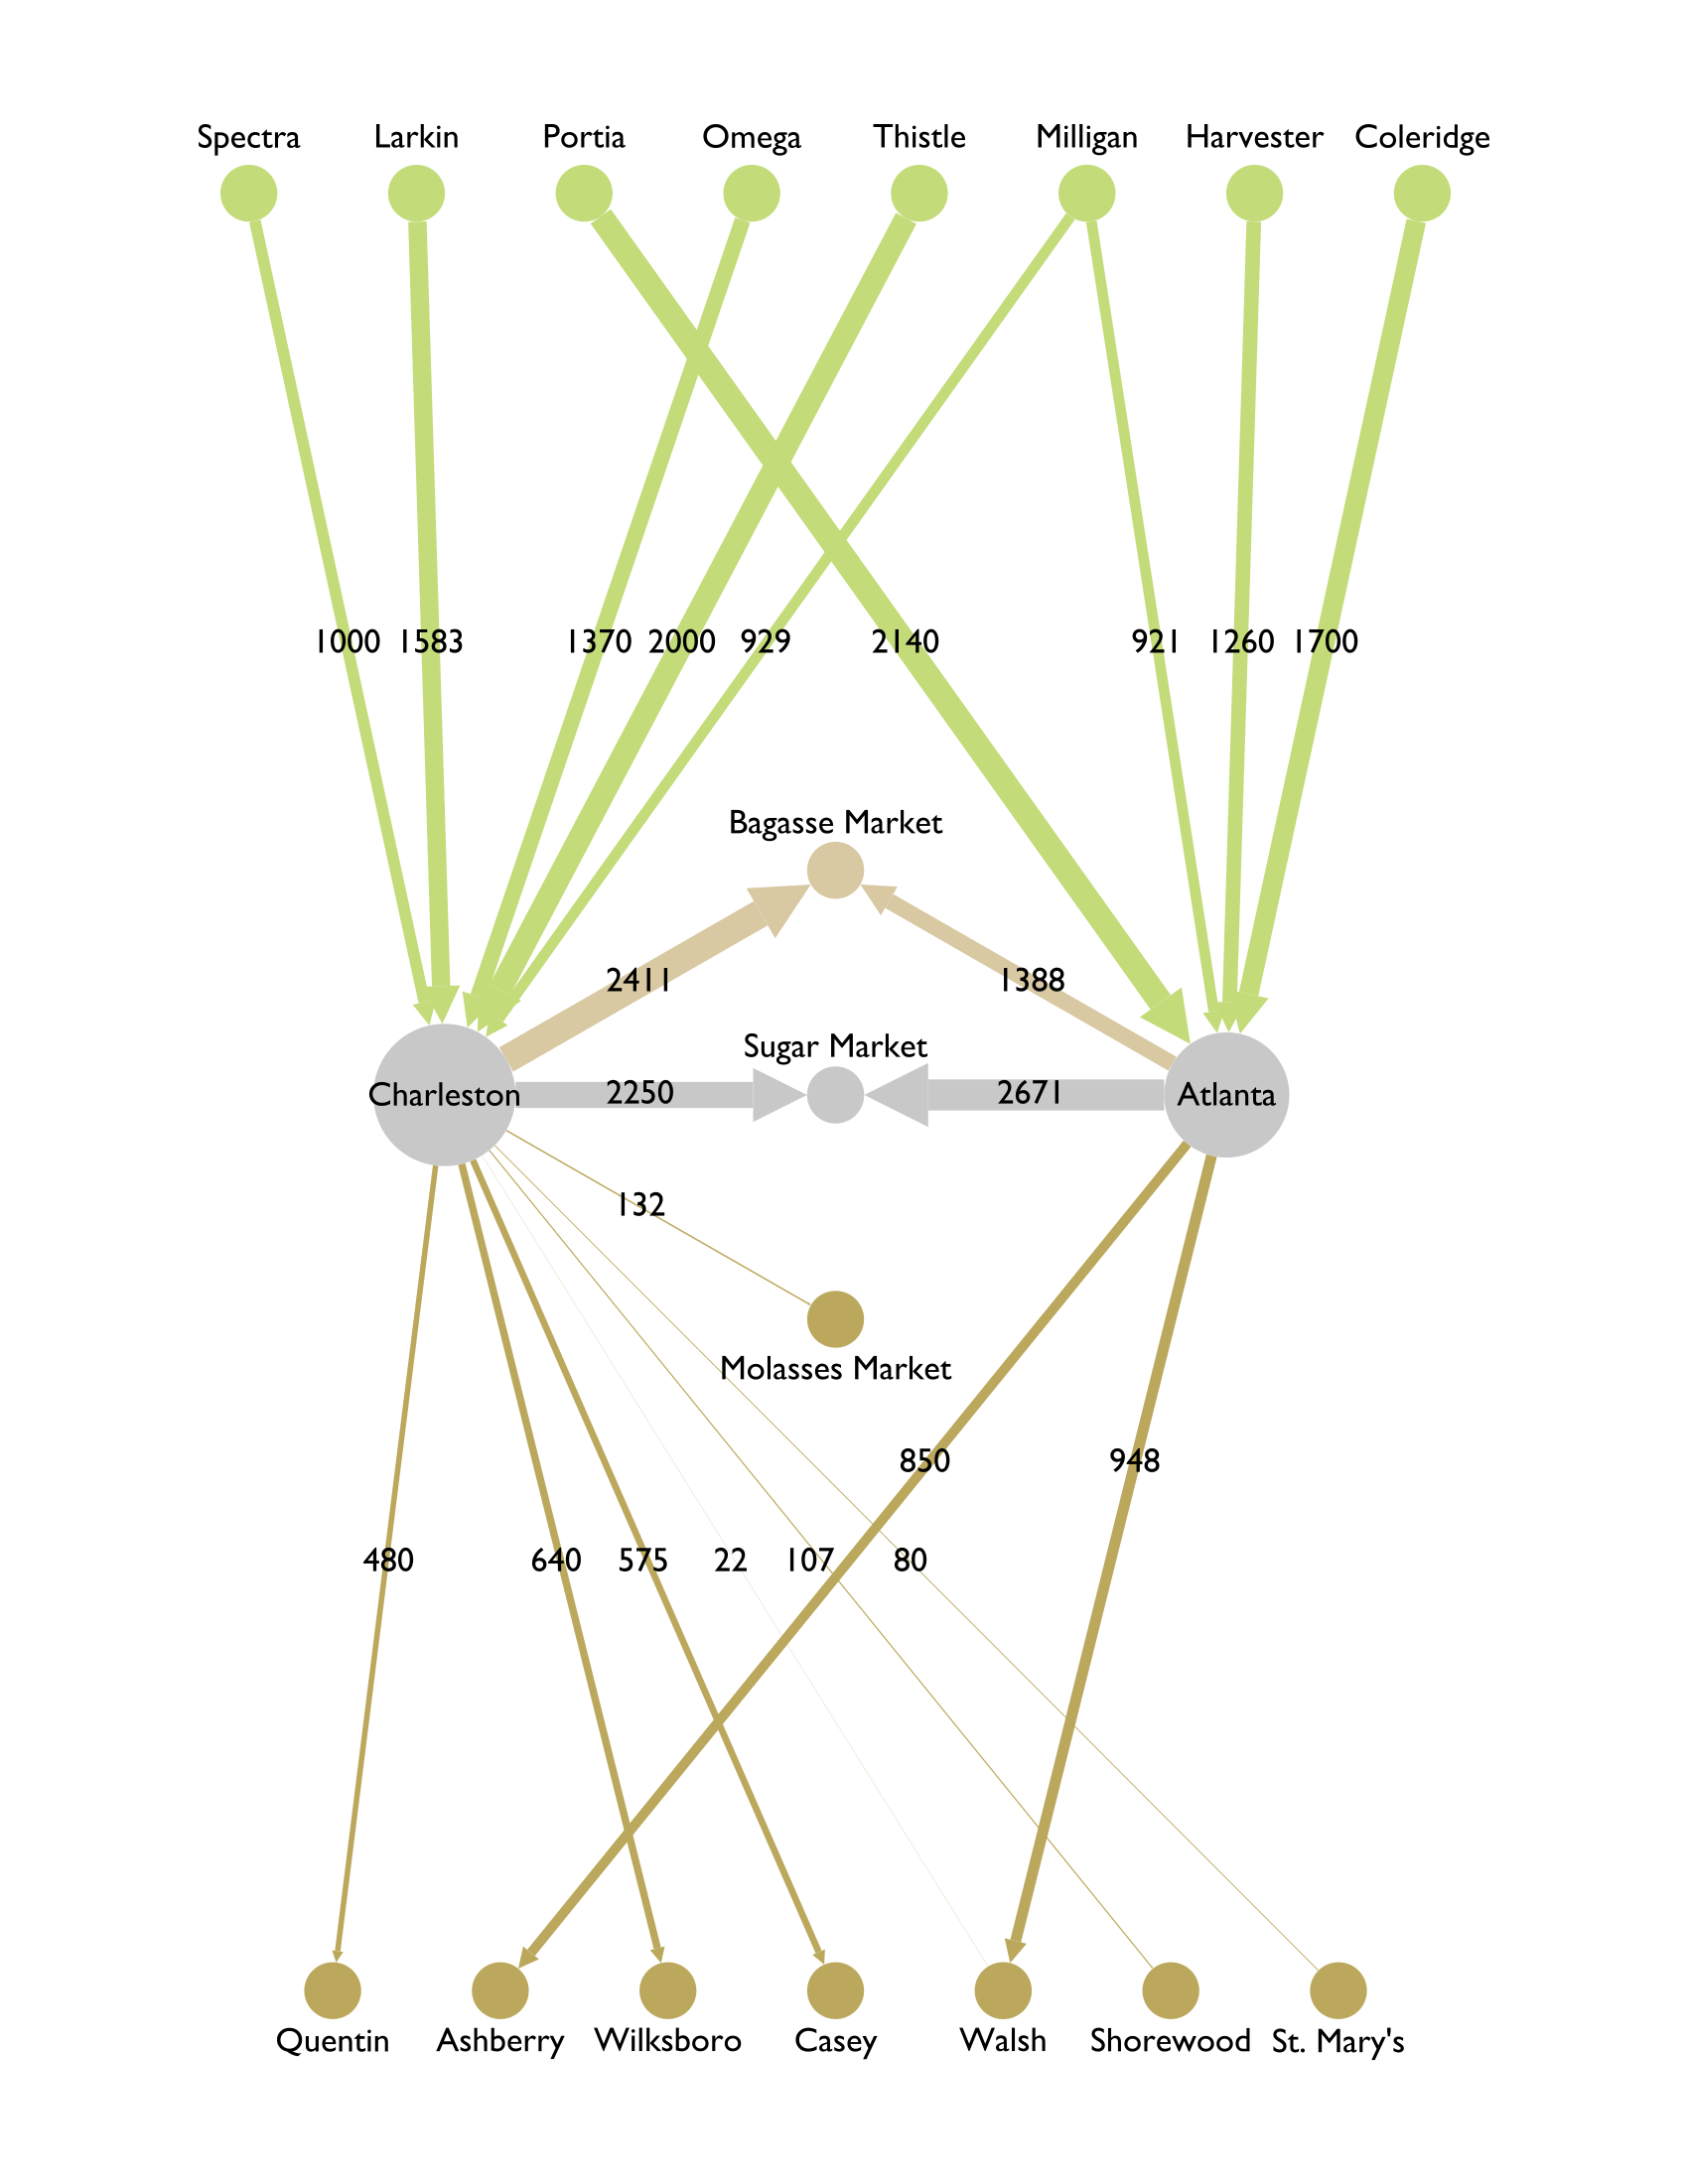
- Co-Authors: Yulie Park, Christian Simeon, Yifan Xia
For our final project in a linear programming class, we were told to optimize the supply chain for a fictional sugar cane company. Sugar cane was bought from different plantations and shipped to different refineries, who in turn shipped molasses to different customers. There were a number of fixed parameters in our model, including the different shipping costs from location to location, the varying productivities and capacities of the different refineries, and maximum supply and minimum demand. Our decision variables were the amount of sugar cane to buy from each supplier and where to ship it, and how much molasses to ship from each refinery to each customer. I wrote the AMPL code to formulate and solve the model, and drew up a nice diagram displaying our optimal results.
San Francisco Giants
- Team: Josh Asuncion, Frank Bruni, Kyle Kishimoto, Tyler Vanderley
 This was the first project I led as a member of SAGB! My team and I worked with Michael Gries of the San Francisco Giants, who tasked us with presenting baseball swing data collected with Blast. We were given data in JSON format on hundreds of swings for different minor league players, containing metrics such as “on-plane efficiency” and “attack angle.” Our final deliverable was a portfolio of visualizations representing each of the different metrics. We concluded this project by presenting to Giants’ front office executives at their spring training facility in Scottsdale, Arizona!
Sacramento County Housing Suitability
- Co-Authors: Bernard Gburek, Valery Yanez
In Fall 2019, I took a class on Geographic Information Systems (GIS). For a final project, we conducted a suitability analysis to find the best place to construct and sell a home in Sacramento County. We collected geospatial data on all sorts of different features, ranging from recent home sale prices to transportation to flood plains. I even used a centerlines file to build a network to calculate travel times to and from important locations such as schools and Amtrak stations. The end product was a raster-based suitability model to determine the “optimal” place for new construction.
Golden State Warriors
- Team: Grant Hurdle, Ari Pickar, Jason Shan, Daniel Waldman
 The first project I worked on with SAGB was a consulting project with the Golden State Warriors, where our job was to try to project college basketball players to the NBA. The goal was to find players that may be undervalued—the type of player the Warriors might draft with their second round pick. We worked on this in Spring 2018, and our model was really high on Kendrick Nunn. I was a freshman, so I wasn’t too involved in the technical details of the model, but I scraped all of the box score and season statistics data from College Basketball Reference, which we used as inputs to our model.
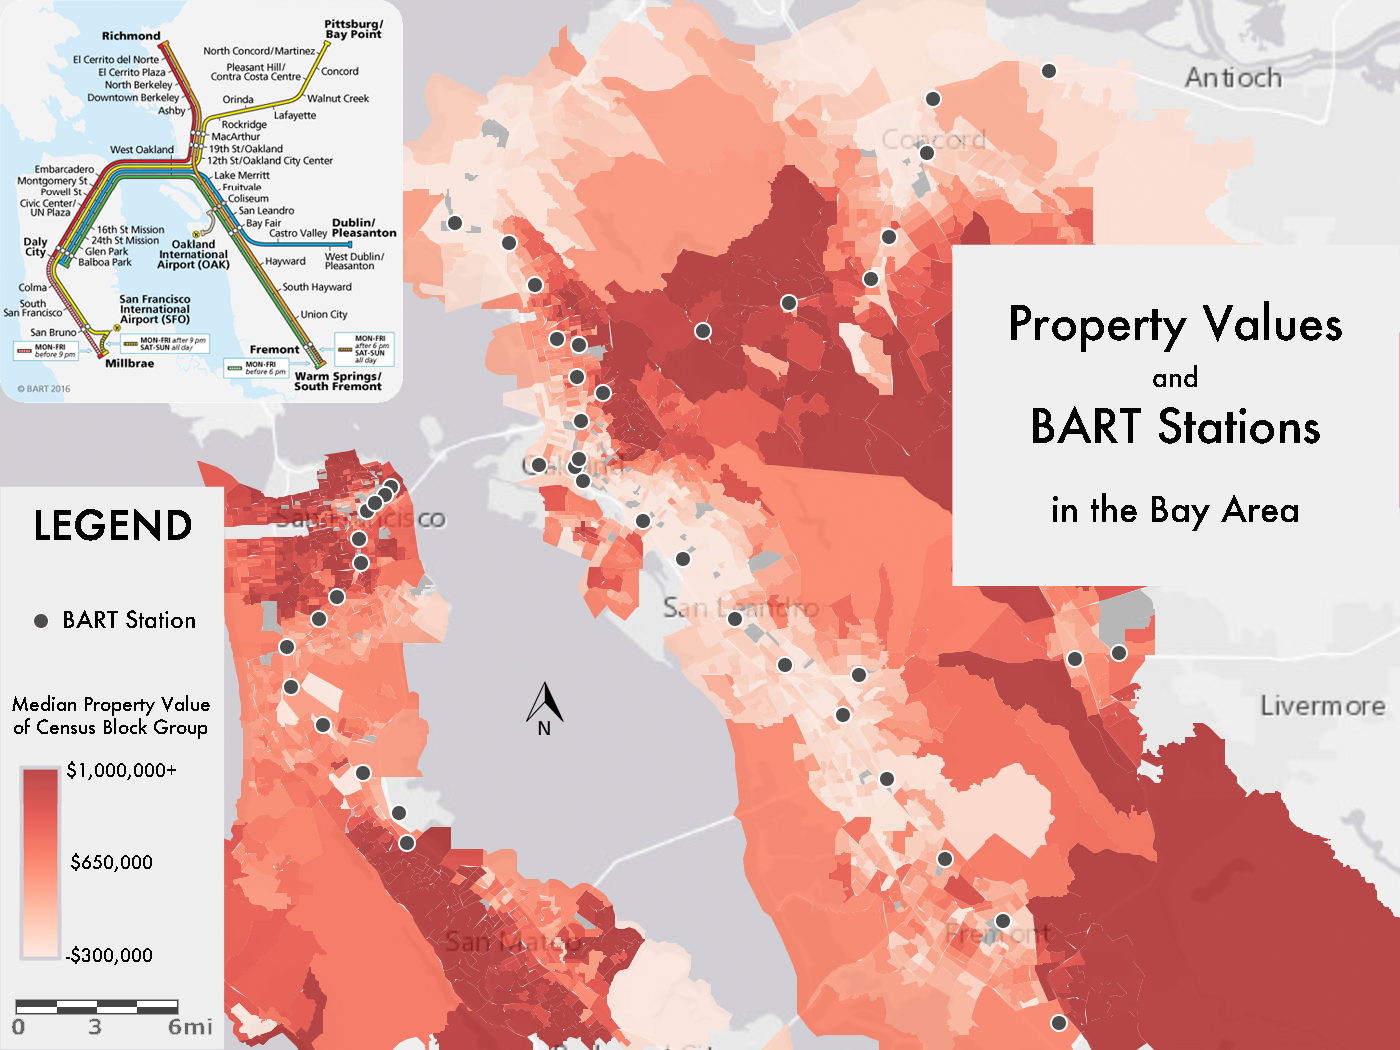
BART and Housing Prices
Freshman year, I took a class in the geography department simply titled “California,” for which we had to make a map as our final project. Being the public transit fan that I am, I chose to look at BART and its relationship with housing prices. I plotted BART stations as points alongside block group polygons joined with American Community Survey data. This was the first map I ever finished, and I’m quite proud of it. My TA didn’t like that I didn’t label the stations and thought that the system map in the top-left corner was intended to fill space, so I assume she’d rather see text covering all of San Francisco and a big empty Marin Peninsula. This map isn’t that old, but note how out-of-date it is! Thank you BART!