Isaac Schmidt
Personal Projects
This page contains descriptions of some additional personal projects I have worked on.
State Border Highway Crossings
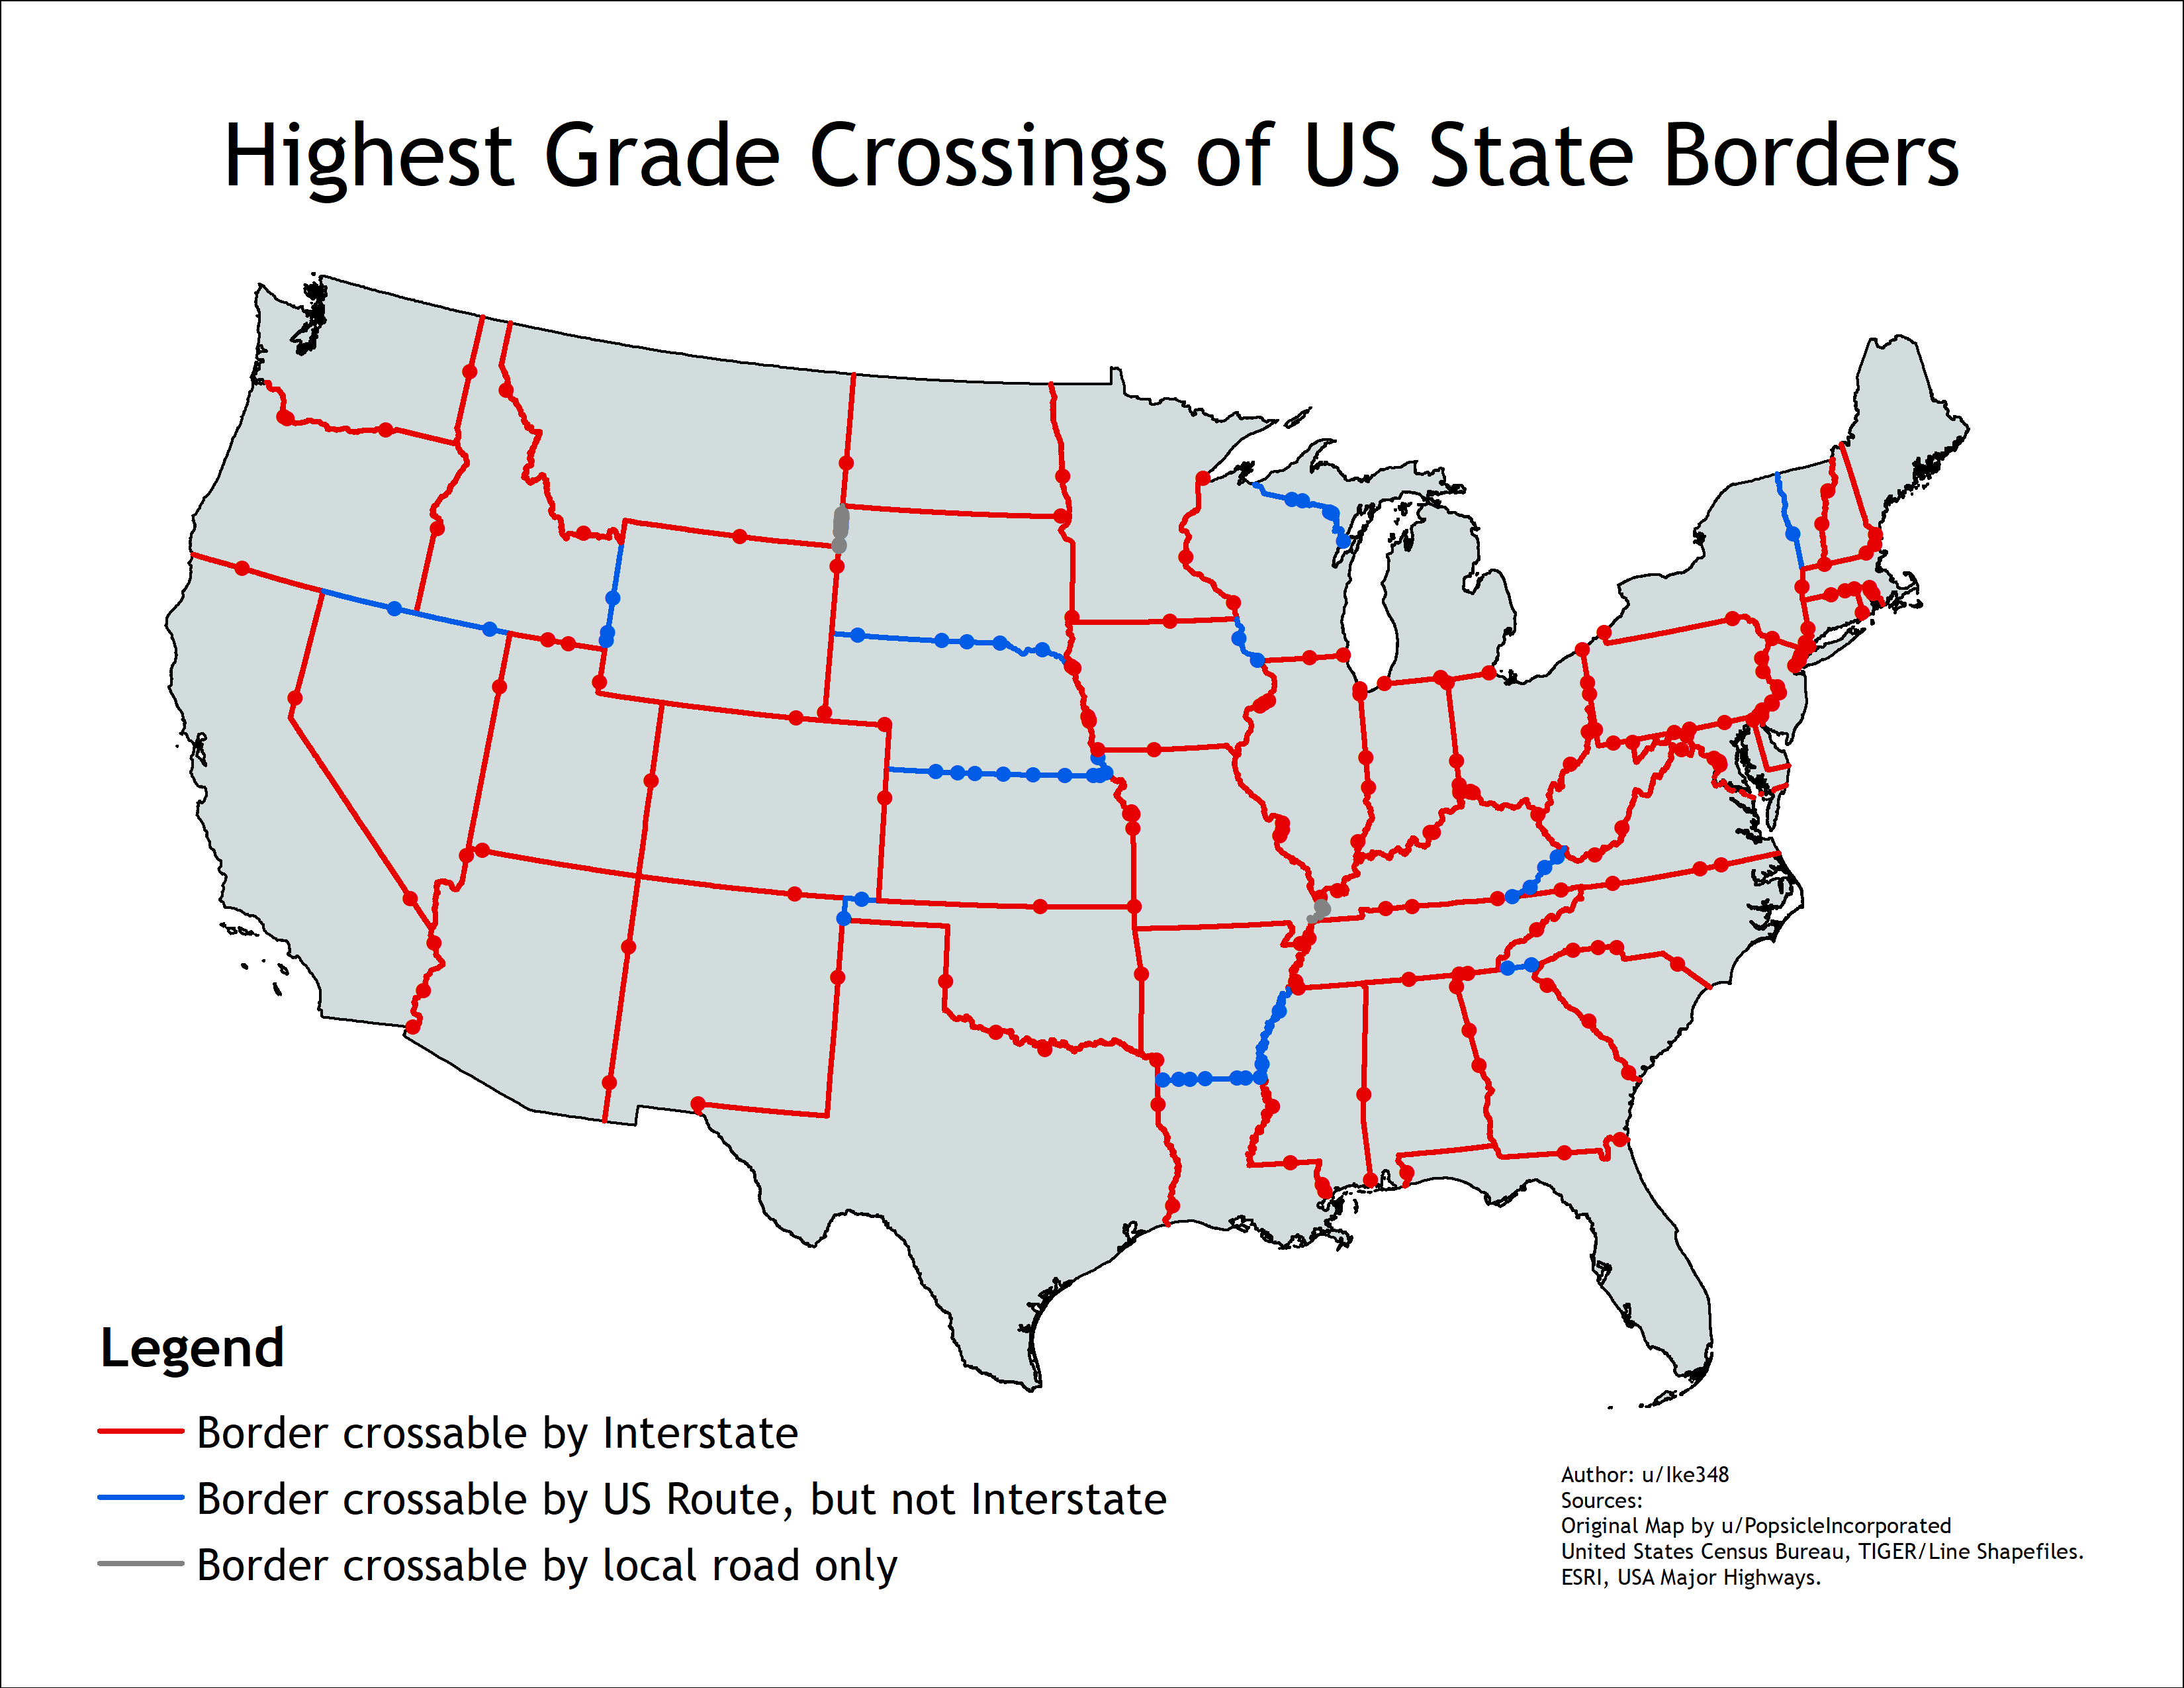
I saw this Reddit post, categorizing each state border by the level of its highest-grade crossing (Interstate, U.S. route, local road, etc.). I noticed a number of issues in the comments, so I decided to make my own, hopefully better, version. Sadly, it didn’t earn anywhere near enough karma as the original, perhaps because it was overshadowed by all of the election maps, as this was done in November 2020.

Streets
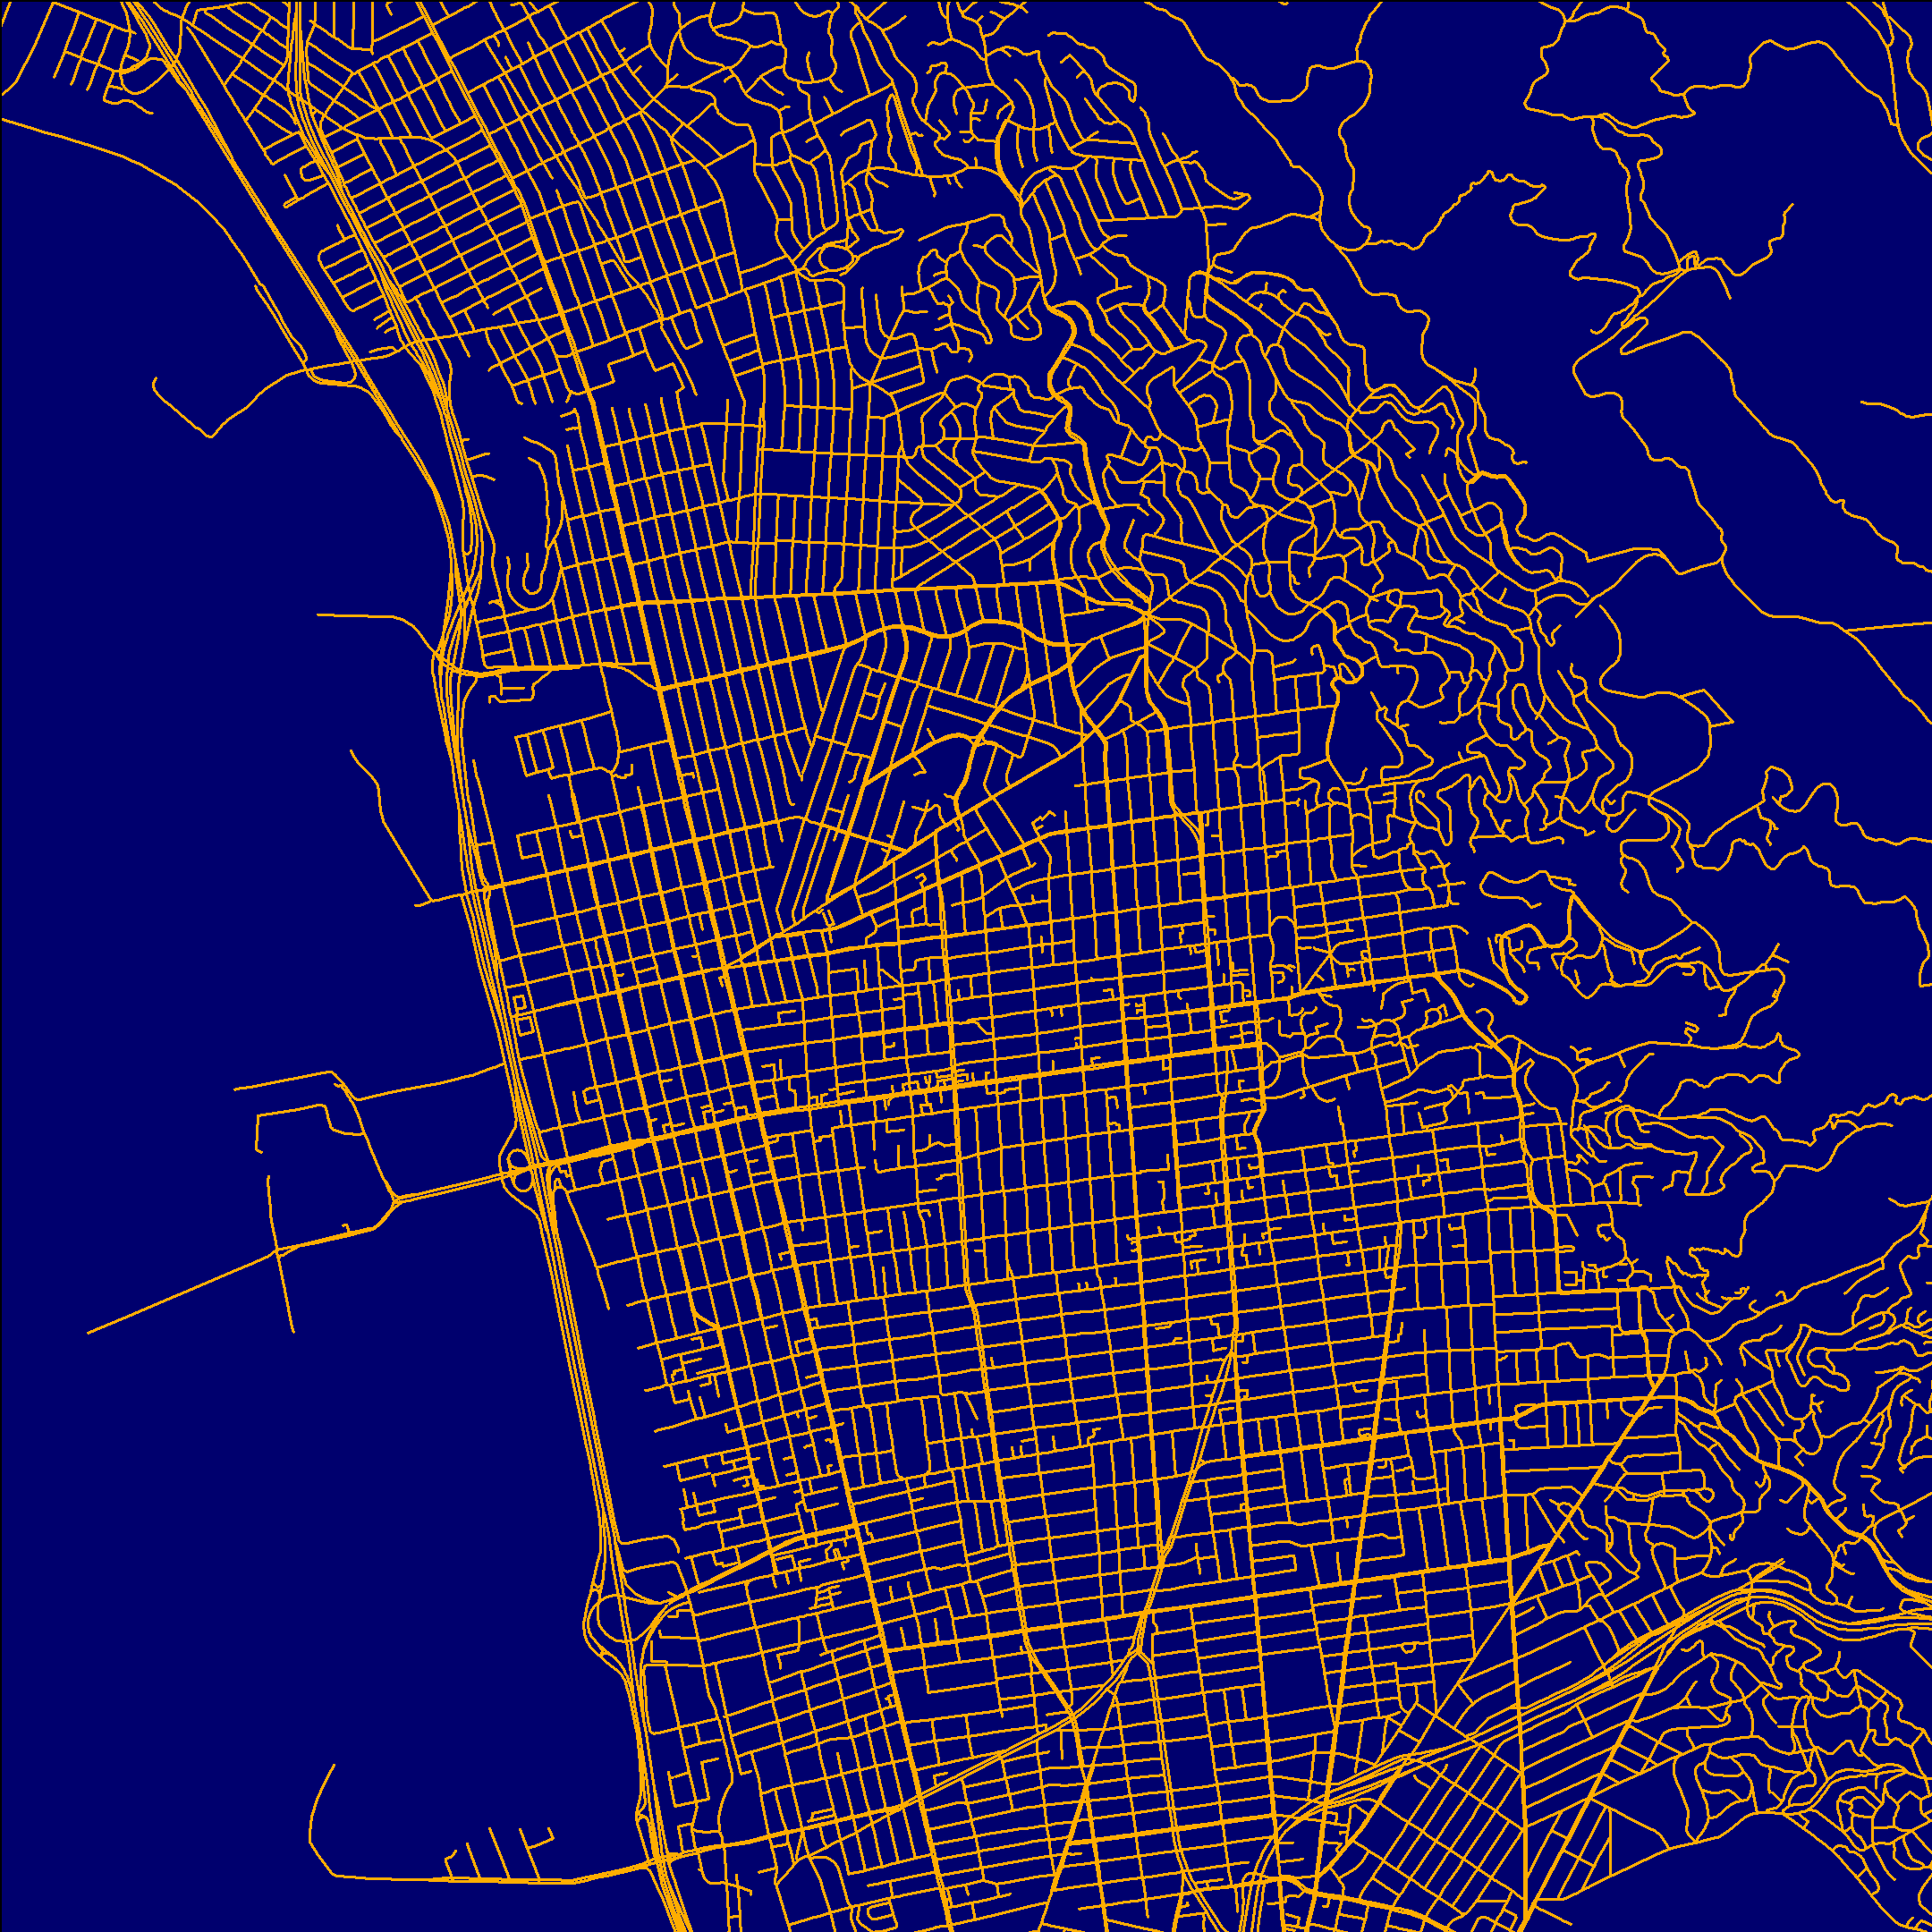
These maps didn’t really require a whole lot of creativity, but they look cool, so I figured I would share them here. Apparently, the U.S. Census Bureau provides freely available datasets containing shapefiles for every road in the country. I downloaded these for a few regions and used them to create “maps” that could be used as wallpapers.
| Philadelphia | Berkeley |
|---|---|
 |
 |
Soccer Highlights
Of course highlights are popular in any sport, but even moreso in soccer. The time zone differences and the sheer quantity of matches lead to a large market for extended highlights, where full matches are condensed down to 10-15 minutes. Creating these highlight packages takes a long time—one has to have watched the match, pinpointed the worthy moments, and then manually sliced the match recording into the different clips before smashing them all back together. To make this process easier, I wrote a Python script that automatically creates highlights videos using match events from the hidden ESPN API. See one of the resulting videos below:
Circles of Suck
 Team A beats Team B, then Team B beats Team C. The transitive property suggests that Team A is better than Team C, but what if Team C also beat Team A?! Redditors on r/CFB and r/CollegeBasketball like to call this a “circle of suck”, where every team has a transitive win over every other. Computer scientists will recognize this as a Hamiltonian cycle within a directed graph, where nodes represent teams and edges the games between them. I’ve created Circles of Suck for all of NCAA D1 college basketball, which consists of over 350 teams. Recently, I used the Concorde solver to find the circle with the maxmimum combined margin of victory across all the games involved, thus emphasizing the “suckiness.”” Check them out here. I also created a “circle of equality” for the 2018-19 Premier League season, which you can see to the right.
u/cbbBot
I am avid redditor, particularly in sports communities. Many of these subreddits have bots that automatically create and update threads for each game, where users can discuss the game and check scores and statistics. In 2016, I reached out to the moderators of r/CollegeBasketball suggesting they build such a bot. Their response—”are you volunteering?” I was only in high school, and I was a novice programmer at best, but I figured I’d give it a shot. I started with asking myself “how do I make a single Reddit post?” and gradually built up from there. My bot first “deployed” in January 2017, and it has been in use ever since!
Since release, it has undergone a number of rewrites as I have learned more and more, but the basic functionality has remained the same. Every day, the bot automatically schedules thread creation for any games involving Top 25 teams. It also listens for user requests to create threads for other games that may not be automatically scheduled. Then, for each game, one hour before its scheduled start, the bot posts a thread to Reddit with all the information about the game (teams involved, records, TV network, etc.), primarily sourced from ESPN. Throughout the game, the bot will update the thread with the current score and time remaining. In the 6.5 years it has been active, it has accumulated over 840,000 karma! Check out the bot account u/cbbBot, and the code on GitHub!
Problems I’m Interested In, But Haven’t Solved
-
Pocket Trains is a mobile game where players operate their own railroad service. There is a select set of cities, and select tracks between them. Players build tracks, then assign them to different railroad lines. There is a fuel cost to traversing a track based on its length, and then a coin reward for delivering cars from one city to another, based on the Euclidean distance between them. We can consider the map to be a graph where the nodes are the cities, and the edges the tracks. The objective is to assign each track to a line such that the overall “straightness” of the system is maximized, with additional constraints on the composition of each line.
-
How to solve the Travelling Salesman Problem when the salesman uses public transit, and we want to minimize time? Specifically, given the Amtrak rail system in the United States, how can we find the optimal tour that visits a select set of stations? Additionally, what if the salesman is a baseball fan, and wants to see a game at all 30 ballparks? Clearly, this is even harder then the standard TSP, because the costs of travelling between cities varies depending on the previous steps the salesman has taken. Introducing the scheduling constraints adds a whole new layer of complexity, because now our salesman needs to stop in a city and stay to watch a game. Interested in thoughts on this!